Facts and Figures |
Papers within the top 10% most cited |
|
|
Papers within the top 10% most cited papers; a three year citation
window.
Figure 1: Number of papers within the top 10% most cited per million inhabitants
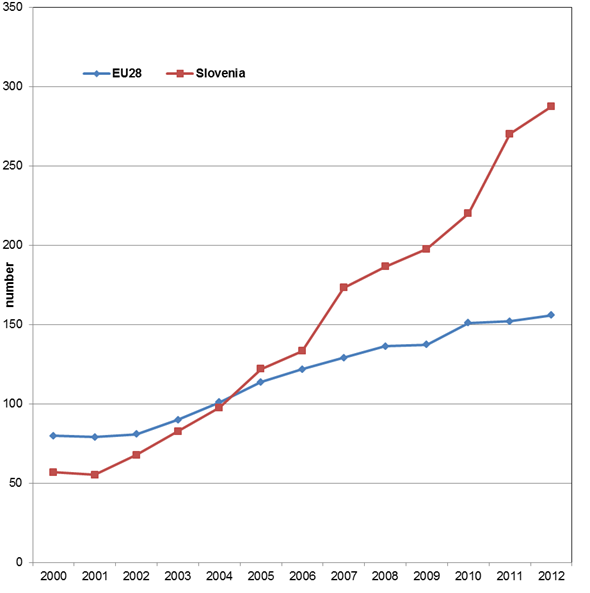
Figure 2: Number of papers within the top 10% most cited and index
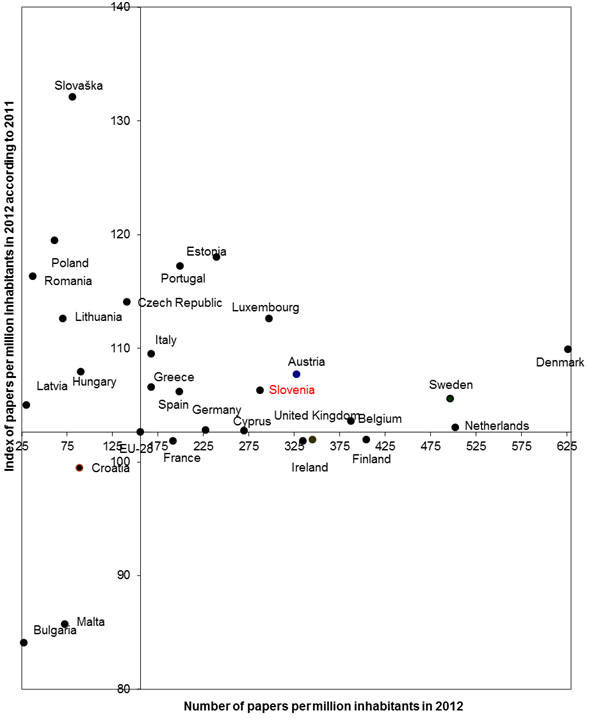
Figure 3: Index of papers per million inhabitants in 2012 according to 2011
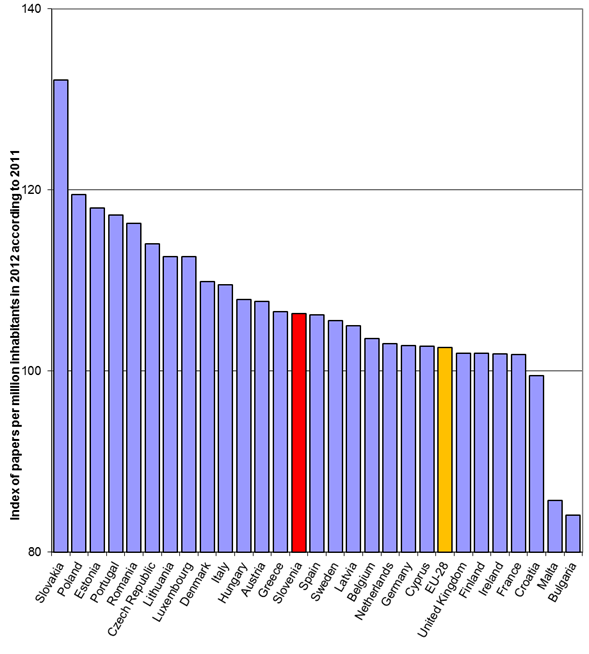
Figure 4: Number of papers per million inhabitants in 2011
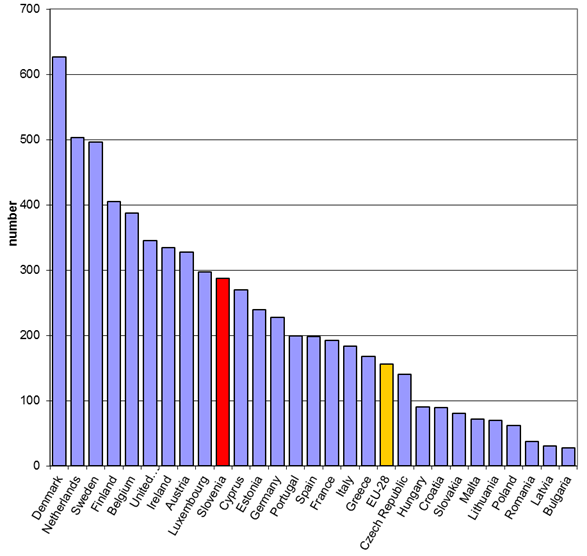
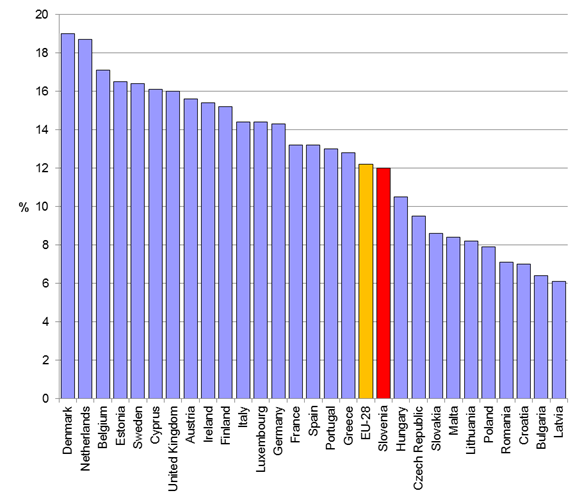
Figure 5: Percentage of papers within 10% most cited papers in 2012
Source: Science-Metrix
|